
Detroit Medical Q3 Report
The success of medical offices in the third quarter of 2020 was very unstable. Each month, the vacancy rate, availability rate and percent leased rate changed drastically. This is likely because of the economic effects of COVID-19, but also because of the need for medical facilities. In order to treat COVID-19, many medical offices were needed. However, for some medical offices, where they did not treat patients diagnosed with the coronavirus, it was difficult to stay open. Although medical offices were essential businesses, many patients canceled their appointments to follow stay at home orders. So, this led to a lack of profits for medical office owners. Also, commercial real estate agents and construction contractors were not allowed to work in Michigan for several months. This resulted in a very unstable market for Detroit medical offices.
Detroit Medical Leasing
At the end of the third quarter, the percent of leased medical offices was just above 76%. While this is much higher than other industries, it is still low for medical offices. Just over 100,000 SF was leased at the end of Q3. With leasing activity for medical offices at 500,000 SF in recent years, 100,000 SF is drastically lower than usual. In addition to this, the median months to lease dropped to just 10 months in Q3. When it comes to relying on leases for profit as a medical office owner, Q3 was not the best quarter.

Detroit Medical Rent
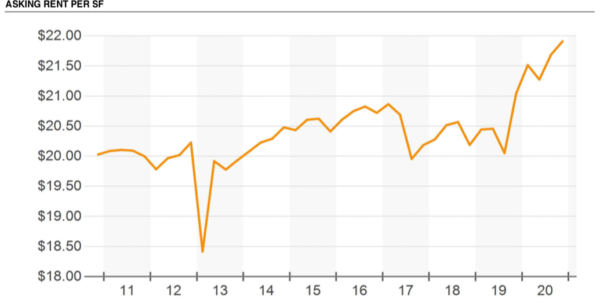
In Q3, the rental market did bring good news to investors. The average asking rental rate per SF was just under $22 at the end of Q3. The average sublet asking rental rate was about $23 per SF. Both of these average rates were much higher than they were in previous years. In fact, the average rental rate was higher than it had been in decades. So, although leasing was not at an optimal rate, the asking rental rates could have made up for lost profits.
Detroit Medical Construction
Q3 was not a busy quarter for construction. This is likely due to the fact that medical office planners and investors were far too busy focusing on COVID, and construction contractors couldn’t work. According to a Q3 survey, there were no construction projects underway. However, in terms of 12-month deliveries, 28,500 SF was delivered. With that being said, it was Q1 and Q2 that brought these deliveries.

Sales
Unfortunately, the sales volume of medical offices in Q3 was at the lowest rate in recent years. Only $5 million have been sold in all of 2020. This is a stark difference from 2019’s $12 million. The average price per SF was also at an extreme low, which was around $51 per SF. Hopefully, once the impact of the coronavirus becomes less severe, sales in the medical office industry will increase.

Economy
COVID-19 has had a direct impact on the medical office industry. Through most of COVID-19, hospitals and family medicine practices have been incredibly busy. This is excellent for the profits of the investors of the medical practices. However, the economy still discouraged new investments. With mass shutdowns to prevent the spread of the coronavirus, there has been minimal cash flow across all industries. The economy is very unpredictable today, so many are hesitant to purchase new medical offices. But, the sector has still remained profitable during COVID-19, so it’s safe to say medical offices remain a good investment today.
Rent & Vacancy
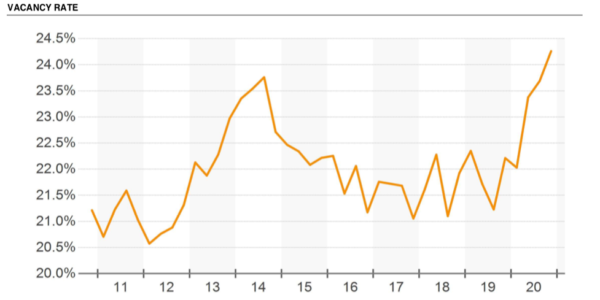
Rent and vacancy in Q3 were relatively parallel. As the vacancy rate went up, the asking rental price went up. At the end of Q3, vacancy rates were about 24.25%. This is around two percent higher than they were in 2019. While this isn’t a large increase, it is still an increase. The increase in vacancy is likely due to medical office boards not wanting to enter new spaces due to the economy.
Detroit Medical Q3 Results
To receive more information on the Q3 results in the medical office market, please sign up for our email list. We will send you a more detailed report with graphs and more statistics so you can make smarter investment decisions in Q4 and in 2021.
